Demonstration Guide
Filtering your Dashboards and Data
Each of your dashboards contains a series of “Widgets” which show data taken from an overnight download of the relevant (required) data from your Class Database. This data is sent into a cloud server where it is attached to our business intelligence engine for you to view in many different ways.
Default Filters
Your Filters are set to a default configuration. This default can be changed using the triple bar icon and selecting ‘Set as my default filters’.
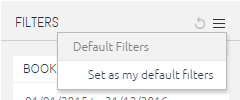

Using the Filters
The filters on the right hand side allow you to adjust the information shown across the dashboard in one press. Please note that each widget will show a progress icon until the dashboard has refreshed according to the new filter selection. Depending on your internet connection speed this make take a few moments.
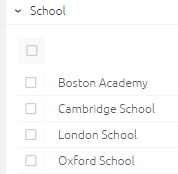
- In the example figure 1 below, select the top box (shown above ‘Boston Academy’ filter) to toggle “All On” or “All off”
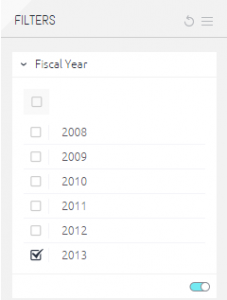
- You can also select and deselect individual or multiple filters as required by clicking in the check boxes next to the data you wish to see. (figure 1)
- You can also switch the entire filter on and off using the slider on/off switch at the bottom of the filter section. (figure 2)
 |
 |
| figure 1 | figure 2 |
Unfiltered Widgets
Some of your widgets will be unfiltered because the data would not make sense using different filters. This will be identified on the header of the widget in the heading and “i” button as follows.
Additional Filtering on the Dashboard
When you drill into e.g. a pie chart and select an individual country or agent, this will change the filtered widgets to all now reflect this selection only. In the example below an additional filter will be placed at the bottom of filters panel to reflect that a user has clicked on the ‘Czech Replublic’ slice in the pie chart.
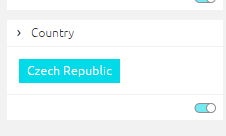


- In order to remove this filter you can either switch off the filter switch, re-click on the widget/pie chart or select the “Clear Selection” button.
- To clear multiple filters you can select the “X” button on the widget header to take the widget back to its top level filter.
Drilling into Pie Charts
Pie charts can be drilled into to obtain more detailed analysis of a specific country or agent for example. This can be done by “Right Clicking” on a slice of the chart and then selecting the appropriate Heading e.g. Country or Agent.
Specific Territory, Country or Agent Dashboard Breakdown
When using Pie Charts you are also able to select a specific territory, country or agent by “Left Clicking” on it. When doing this you will notice the widgets across all of the filtered dashboards refresh to now show the data for this specific selection. E.g. select “AA Japan” agency and the entire dashboard will now refresh to show you their performance according to the filters.
Production Dashboard Date Filters
On the production based dashboard you will find four date range filters. These have been designed to allow you to show production statistics (when are students in your school) based on a particular booking period. So you could choose to see e.g.
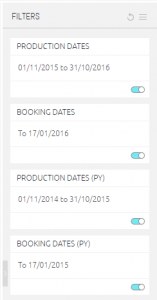
- How many students are expected in your school this year that are currently booked compared to the same booking point last year.
(To do this change the Bookings Dates (PY) date to the todays equivalent date last year) - How many students are booked for this compared to the total bookings for last year.
(To do this change the “Bookings Dates (PY)” date to include all bookings from earliest date to today’s date date)

Additional Widgets Features
Widgets can be expanded to full screen using the double arrow icon as shown below.

Exporting from Class Sense.
It is possible to export and download your dashboard using the download button at the top right of the dashboard.


You will be given the option to download the data as follows:
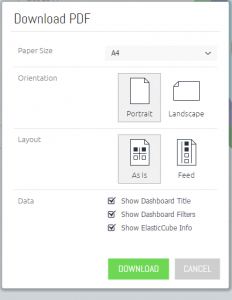
Exporting an Individual Widget
It is possible to download individual widgets by clicking on the following icon on each widget.

And then selecting the type of download required from the dropdown list as shown below.


And then selecting the type of download required from the dropdown list as shown below.

Refreshing and Restoring
You can refresh the widgets to restore your default filter settings using the refresh button.

If you accidently change the configuration of any other part of your dashboard and want to restore it back to the original configuration then you can restore your dashboard here:

If you accidently change the configuration of any other part of your dashboard and want to restore it back to the original configuration then you can restore your dashboard here:

For further information or should you have any problems please contact [email protected]

